ENVIRONUser guide
Monitor environmental readings, record CSV sessions, reset your comparison reference and review saved recordings on the touchscreen.
Contents
- Get to know ENVIRON
- Power, reset and charging
- Use the main menu
- Start monitoring and recording
- Read the sensors and graphs
- Reset the reference with ZERO
- Choose the recording default
- Find your CSV recordings
- Browse files on ENVIRON
- Review recordings on a computer
- Set the date and time
- Connect to Wi-Fi
- Connect to ParaLink-Mesh
- Update firmware
- About
- Troubleshooting
Get to know ENVIRON
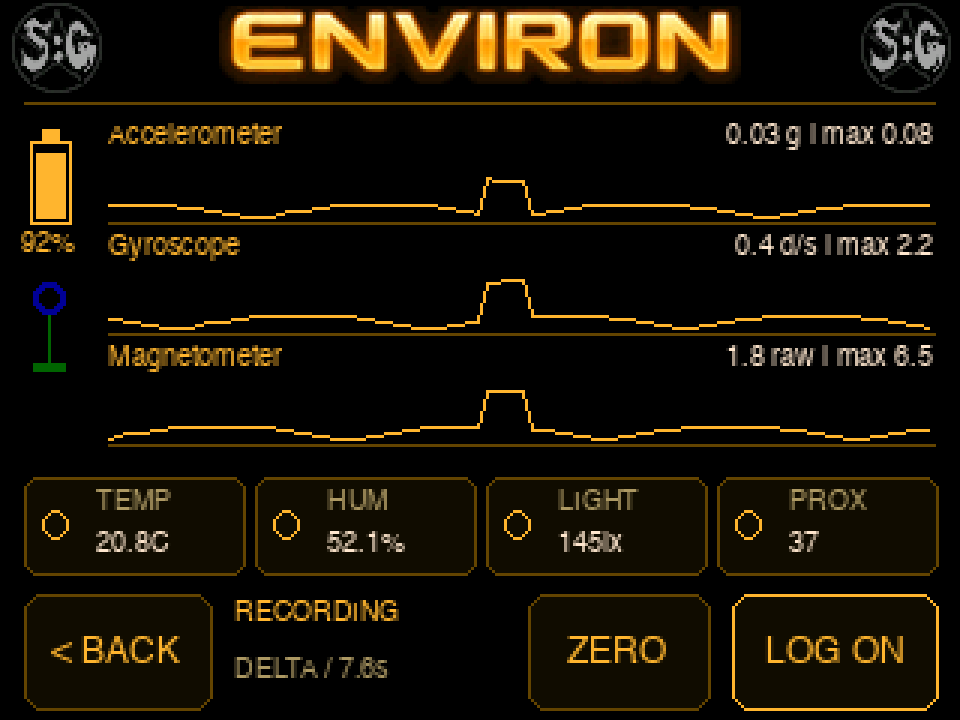
ENVIRON uses a touchscreen. Tap its menu icons and labelled buttons. On the monitoring screen, the three scrolling graphs show changes in acceleration, rotation and magnetic readings, while four tiles show current temperature, humidity, light and proximity readings.
| Control | Action |
|---|---|
| Left-side power button: one press | Turns ENVIRON on. |
| Left-side power button: hold 6 seconds | Turns off; USB can stay connected and charging continues. |
| Bottom RST: brief press | Restarts ENVIRON. |
| Monitoring screen: < BACK | Leaves monitoring and stops CSV writing. |
| Monitoring screen: ZERO | Resets the comparison reference and clears the live graph history. |
| Monitoring screen: LOG ON / LOG OFF | Toggles recording. The label shows the current state, not a command to tap next. |
Power, reset and charging
- With the device off, insert the supplied microSD card and keep its supplied licence and configuration files.
- Press the power button on the left side once. Wait for startup; ENVIRON opens on its icon menu.
- To switch off, leave the monitoring screen with < BACK so recording has stopped, then hold the left-side power button for about six seconds.
- To charge, connect the USB-C port to a suitable 5 V USB source. USB connection may turn ENVIRON on automatically.
- To charge while switched off, leave USB connected and hold the power button for six seconds. Charging continues with the device off. Disconnect USB when finished.
If the app becomes unresponsive, briefly press the bottom RST button once to restart. This is not a factory-reset command. Holding RST for about three seconds enters hardware download mode; use a brief press for normal restart. Do not reset, unplug or switch off during a firmware installation.
Power and RST button actions are checked against Hardware power reference.
The battery icon and percentage on the monitoring screen are amber normally, red at a reported level of 25% or lower, and blue when charging is reported. –% means the level is unavailable. A dark screen after a six-second shutdown does not mean charging has stopped.
Use the main menu
| Row | Left to right |
|---|---|
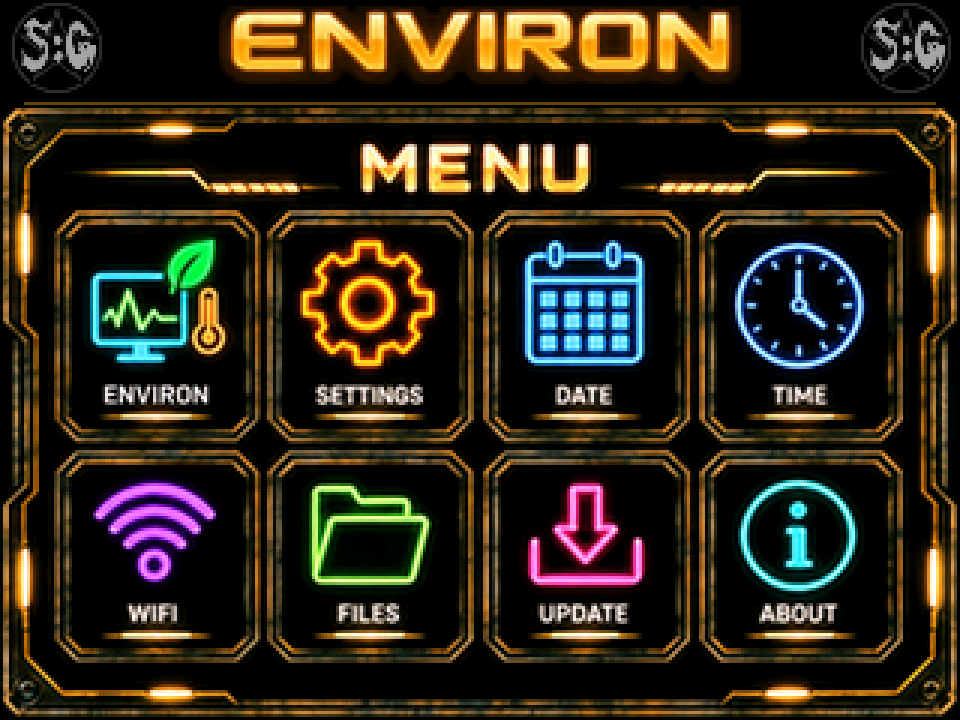
| Top row | ENVIRON monitoring, Settings, Date, Time |
| Bottom row | Wi-Fi, Files, Update, About |
Start monitoring and recording
- Put ENVIRON in the position you want to monitor. A stable surface reduces the effect of handling on movement readings.
- Tap the monitoring icon at the top left of the menu. Sensors start, a new comparison reference is taken, and live graphs appear.
- Logging is enabled by default after a restart. If it is on and the card is writable, opening monitoring creates a new CSV file and begins recording. Check for RECORDING and LOG ON.
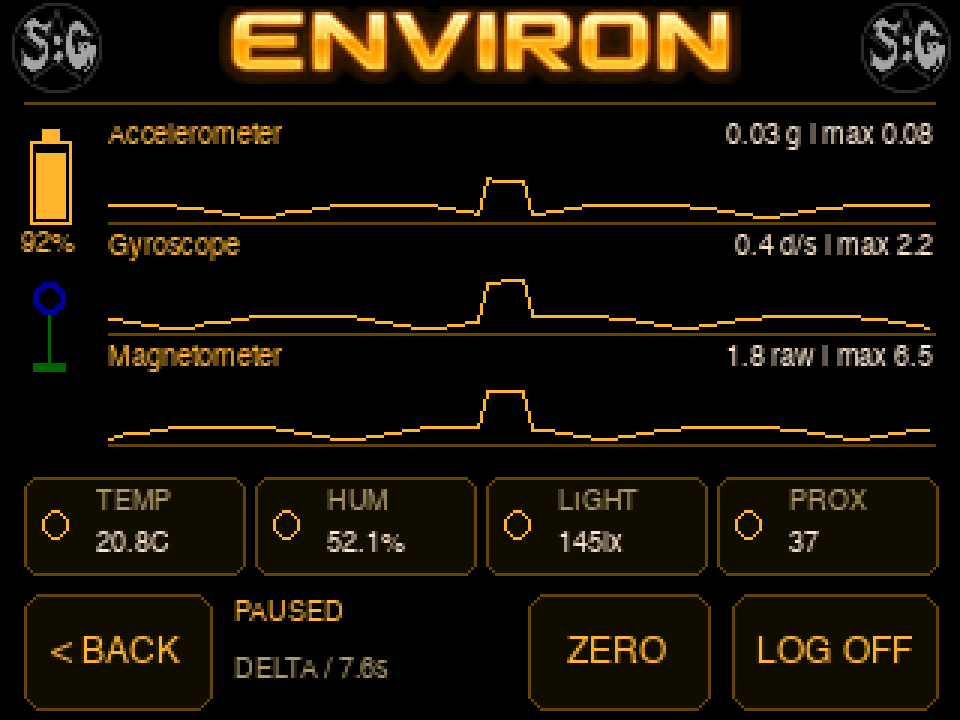
- Tap LOG ON to pause recording. It changes to LOG OFF and the status becomes PAUSED. Live readings continue.
- Tap LOG OFF to resume recording. Each resume creates a new file rather than appending to the previous session.
- Tap < BACK to return to the menu. CSV writing stops when monitoring is left; it does not continue in the background.
CSV rows are normally written about four times per second. Movement, magnetic and optical readings refresh faster than the temperature and humidity sensor, which refreshes about every two seconds. Repeated temperature values in nearby CSV rows are therefore normal.
Read the sensors and graphs
| Display | Meaning |
|---|---|
| Accelerometer graph – g | Magnitude of the change in acceleration/orientation readings from the reference. Handling or tilting the device affects it. |
| Gyroscope graph – d/s | Magnitude of the change in rotation-rate readings from the reference. |
| Magnetometer graph – raw | Magnitude of the change in magnetic sensor readings from the reference; not a calibrated EMF dose or safety reading. |
| TEMP | Current temperature from the environmental sensor, shown in °C. |
| HUM | Current relative humidity, shown as a percentage. |
| LIGHT | Calculated ambient light in lx (lux) or klx (thousands of lux). HIGH means saturation; — means unavailable. |
| PROX | Raw proximity-sensor response. It is not a distance in centimetres. |
The live graphs cover approximately 7.6 seconds and automatically rescale. Their max labels show the current scale limit with headroom, rather than an all-time maximum. A taller line can reflect a changed scale, so read its number as well. These are change magnitudes, so they do not show whether a temperature or magnetic reading went up or down.
NO DATA on a graph or — in a tile means there is no valid current reading. The CSV leaves invalid fields empty instead of recording a false zero. Keep fingers away from the optical sensor when observing light and proximity; nearby objects, illumination and device movement can affect readings.
Reset the reference with ZERO
- Leave ENVIRON still in the position you want to use as the new starting point.
- Tap ZERO on the monitoring screen.
- The comparison references and live history reset. Valid change readings return near zero and new changes are measured from this point.
ZERO changes the comparison reference; it does not perform factory sensor calibration or delete earlier CSV readings. If logging is active, it continues in the same file. The BaselineId column changes so you can identify the new reference in the saved data. Opening monitoring again also establishes a new reference.
Choose the recording default
- Leave monitoring using < BACK, then open Settings.
- Tap the CSV logging ON/OFF control. The choice applies when you next open monitoring.
- Tap < BACK to return. There is no SAVE button on this Settings screen.
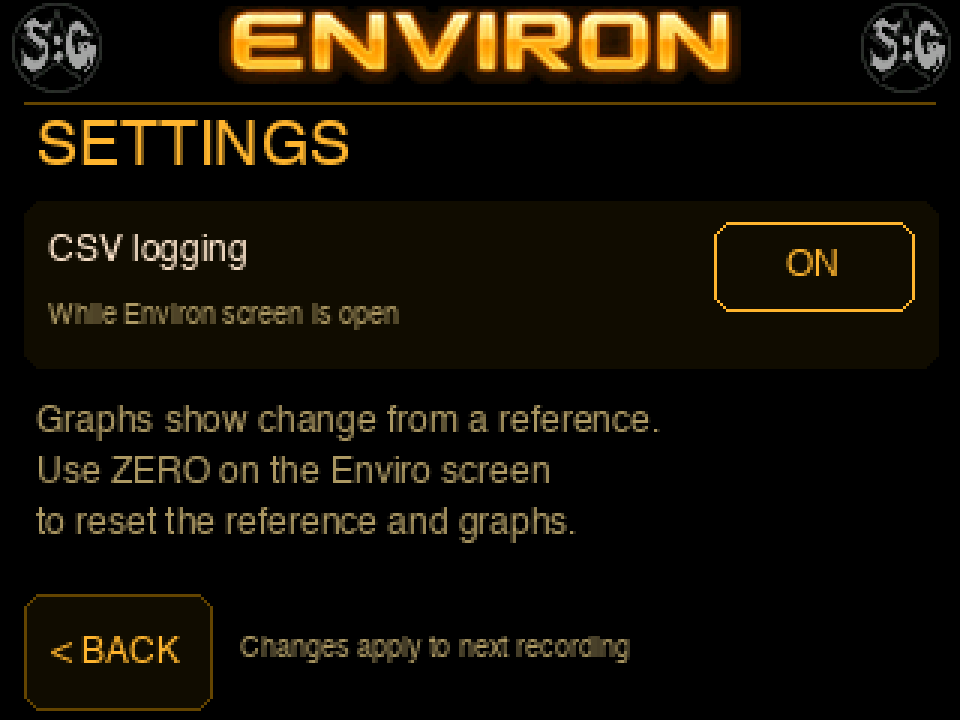
The recording choice is held for the current run; this version does not save it to the configuration file. Logging returns to its enabled default after restarting. Use LOG ON/OFF on monitoring to pause or resume the current recording.
Find your CSV recordings
Files are saved directly on the microSD card. When a valid internet or RTC clock is available, recordings go in DateTimeFiles/ with names such as Environ_2026-10-18_14-30-00.csv. Recordings created with the same timestamp receive a suffix so older files are preserved. Without a valid clock, files go in NumberedFiles/ with names such as Environ_1.csv.
The Millis column records device uptime in milliseconds; it is not a separate wall-clock timestamp for every row. CSV data includes raw motion and magnetic axes, temperature and humidity, change values, raw optical readings, calculated lux and BaselineId. Keep a note of your location and session start time if you want to compare recordings with other equipment.
Browse files on ENVIRON
- Leave monitoring, then tap Files in the menu.
- Choose Numbered files or Date & time files. Files from nested folders are included in the list.
- Use UP, DOWN or a vertical swipe through the list to move through recordings. Files are listed newest first where reliable dates are available.
- Tap a filename to open its contents. Use UP/DOWN or vertical swipes to change pages.
- Tap < BACK to return to the file list, then again to the folder choices. REFRESH reloads the list.
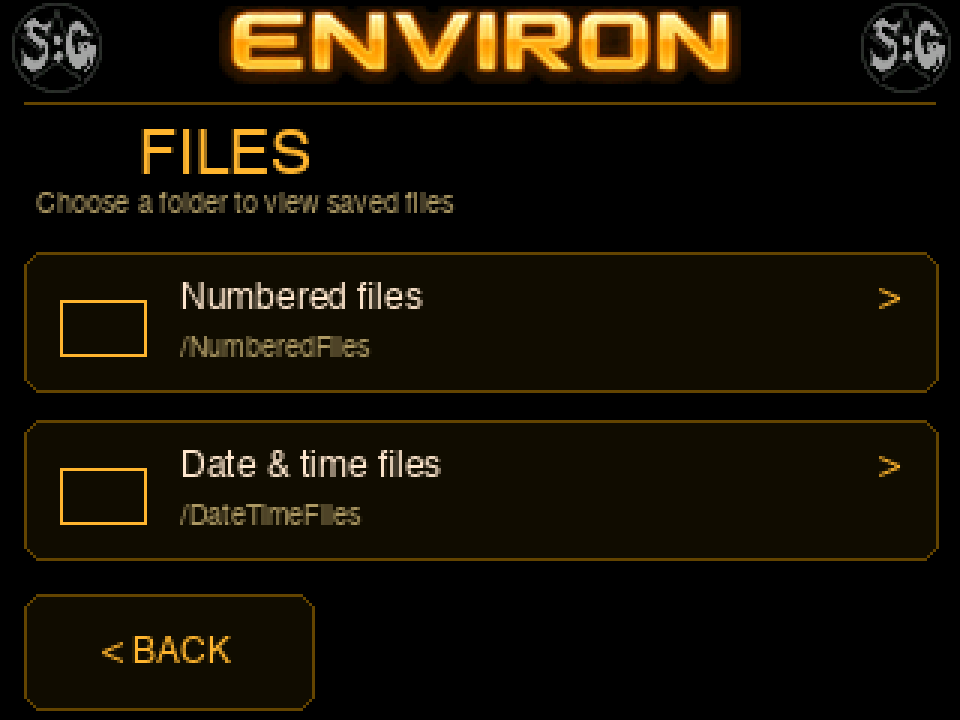
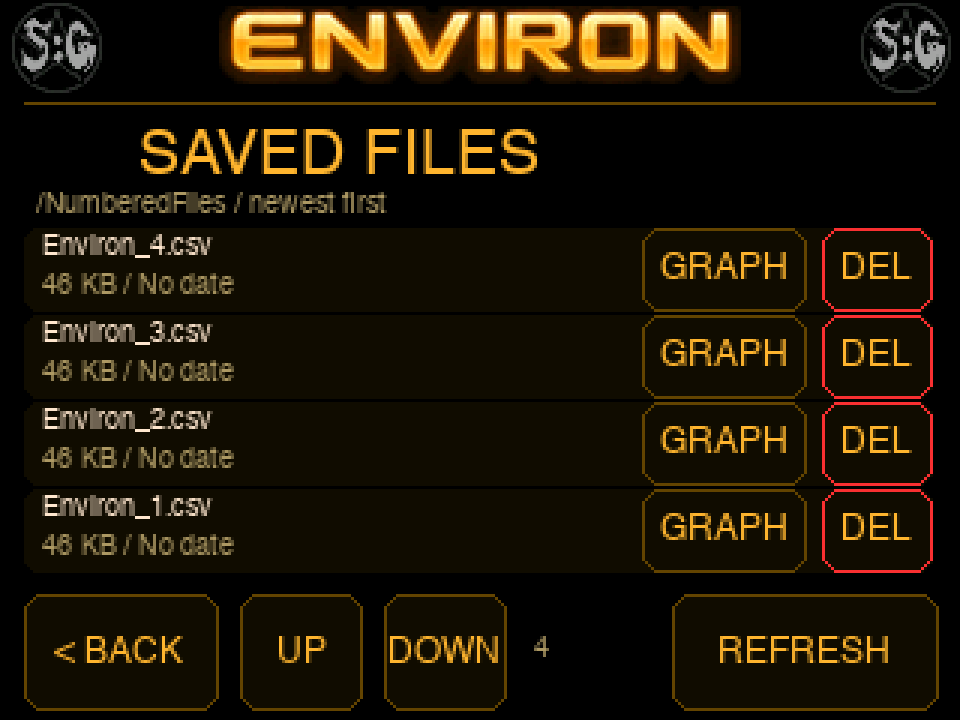
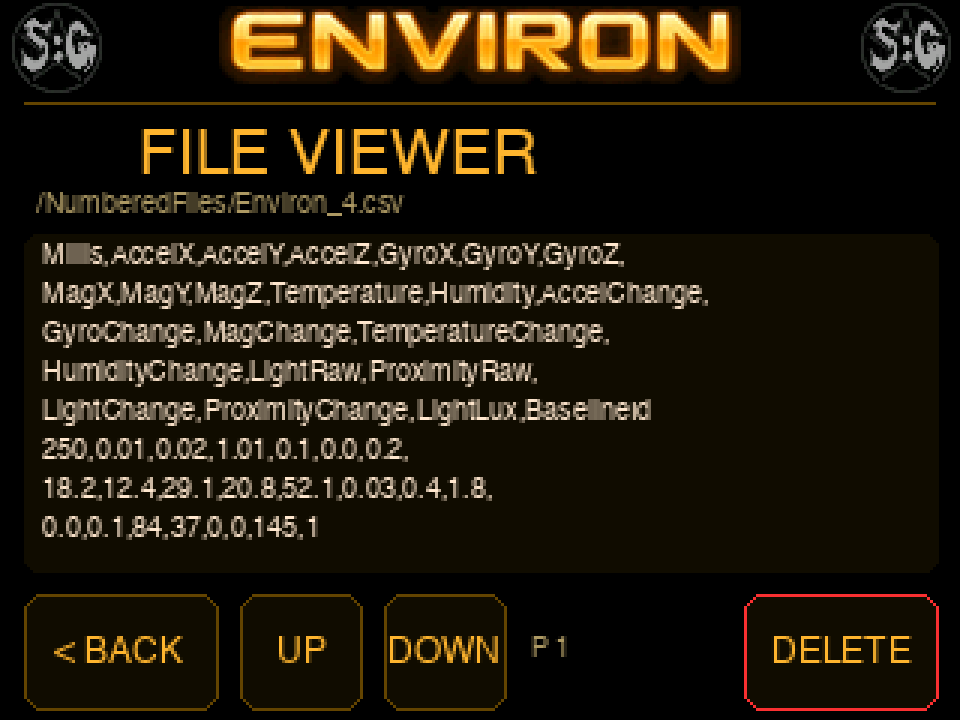
CSV lines may wrap across the small display. Binary files are shown as hexadecimal rather than as readable text; the device does not turn them into pictures in this viewer.
View a saved sensor graph
- In the file list, tap GRAPH beside a compatible ENVIRON CSV recording.
- Use the lower < and > controls to cycle its seven sensor-change graphs: Accelerometer, Gyroscope, Magnetometer, Temperature, Humidity, Light and Proximity.
- Read the graph against its vertical scale and elapsed-time labels. Tap < BACK to return to the file list.
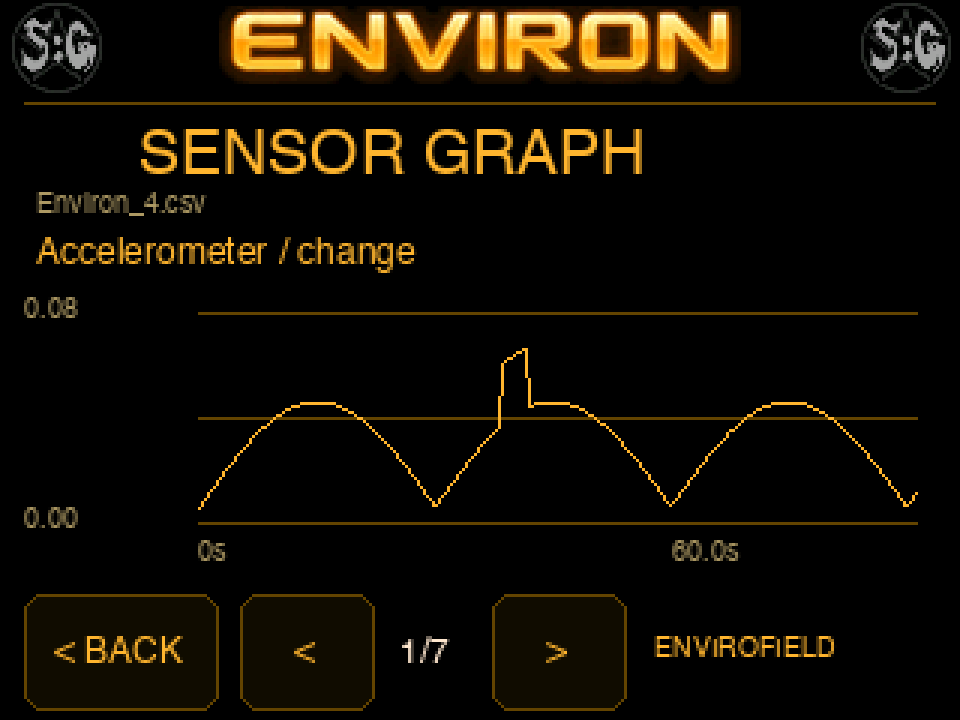
The on-device graph plots the saved change columns. Temperature and humidity graphs therefore differ from the live tiles, which show current absolute readings. Long recordings are condensed across the screen while retaining the low and high values in each interval. Missing or incompatible columns can produce No data column for this sensor.
Delete an unwanted file
- Tap DEL beside the file in the list, or DELETE in its text viewer.
- Check the full filename on the confirmation screen.
- Tap CANCEL to keep it, or DELETE to permanently remove it.
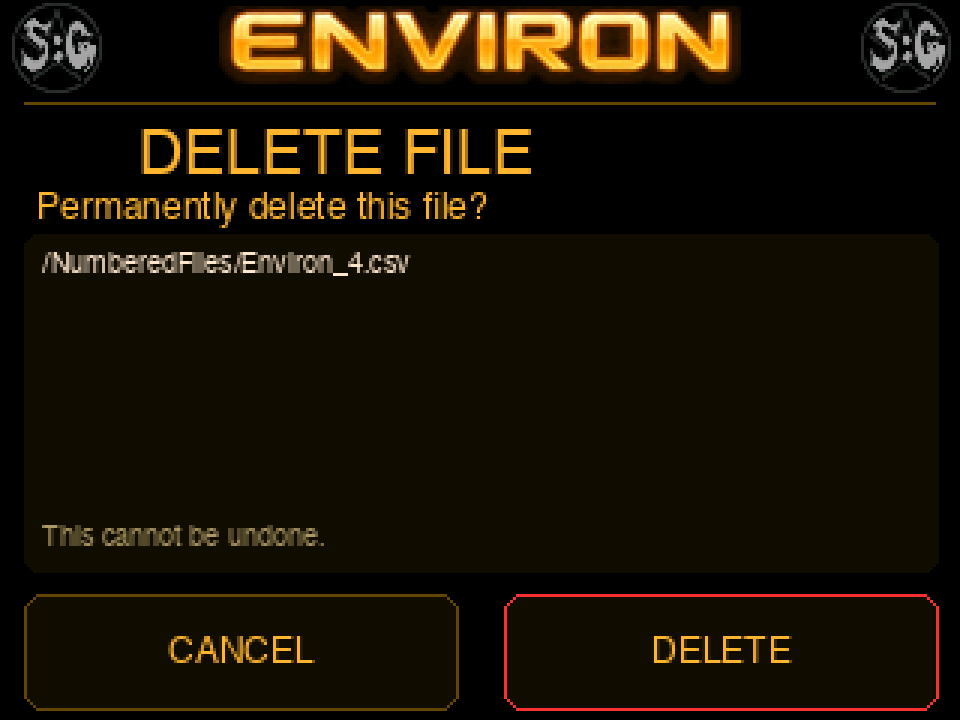
Deletion cannot be undone on the device. Copy recordings you want to keep before deleting them.
Review recordings on a computer
- Leave monitoring, switch ENVIRON off, and remove the microSD card.
- Copy the CSV recordings from DateTimeFiles or NumberedFiles to your computer.
- Open them in a spreadsheet or compatible CSV analysis tool. For larger graphs, use the ENVIRON Viewer linked from the ENVIRON product page.
- Return the card to ENVIRON before switching it on again.
Open the ENVIRON Viewer. The compatible computer viewer can help inspect the other saved columns too.
Set the date and time
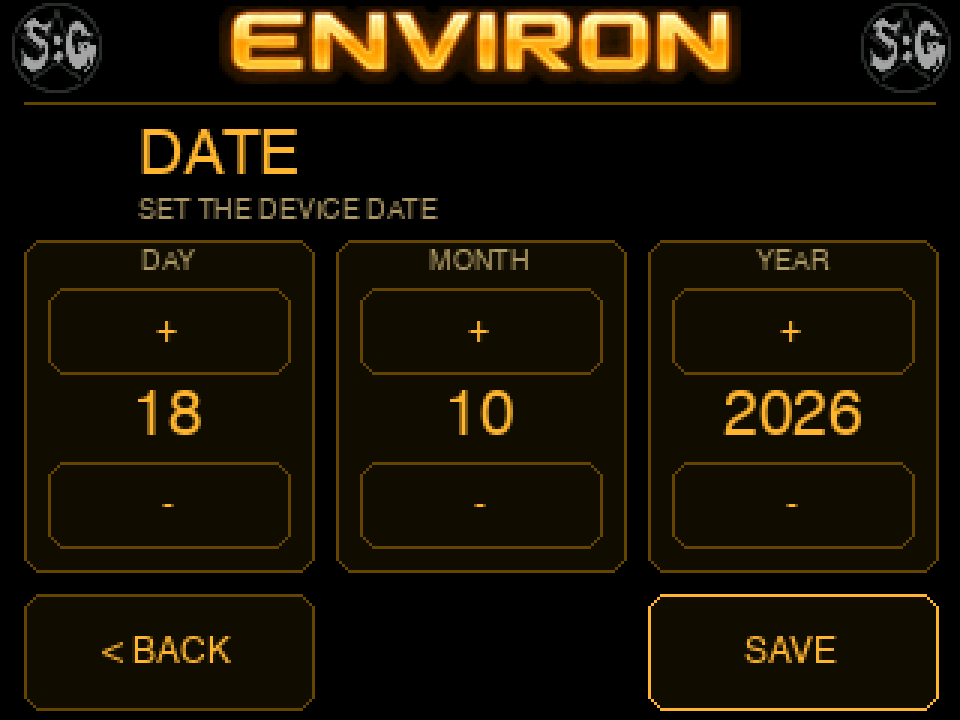
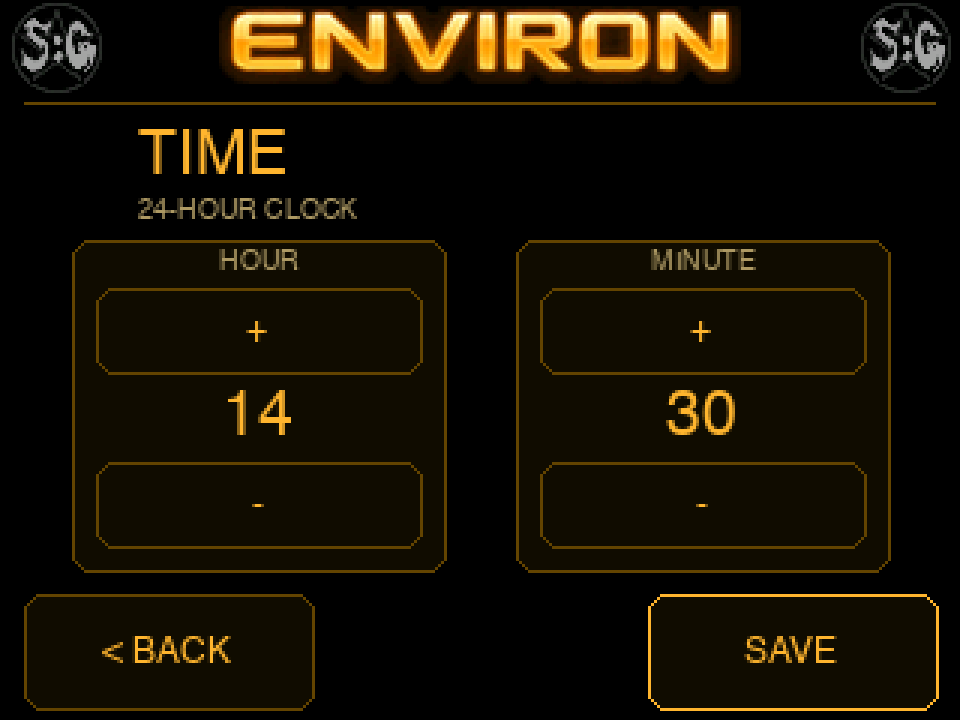
Use the Date and Time menu icons to set the RTC. A valid clock lets new recordings use dated filenames. Startup internet synchronisation may replace a manually set value, so check the clock after reconnecting. There are no Timezone or BST controls on these screens.
- Tap Date. Use the + and – buttons for DAY, MONTH and YEAR. Hold to repeat. Dates are limited to valid days for the chosen month and year.
- Tap SAVE to apply the date, or < BACK to leave without saving.
- Tap Time. Use + and – for HOUR and MINUTE. Hours use the 24-hour format.
- Tap SAVE to set the time; seconds become zero. BACK leaves without applying the edits.
Connect to Wi-Fi
Monitoring and card recording can work without internet. Wi-Fi is used for clock synchronisation, firmware updates and ParaLink-Mesh. Network details are entered in a card file, not typed into the Wi-Fi status screen.
- Switch ENVIRON off before removing the card.
- Open
wifisettings.txtin the card’s root folder with a plain-text editor. - Set the following two lines to your network’s name and password, preserving other settings.
- Save, eject the card, return it to ENVIRON and switch on.
WIFIName=YourNetworkName
WIFIPassword=YourNetworkPassword
Use a phone hotspot
- Enable the phone’s Wi-Fi hotspot or Personal Hotspot. Use 2.4 GHz or its compatibility option if available.
- Put the hotspot name and password into the same two Wi-Fi file fields, replacing the previous network.
- Keep the hotspot enabled, return the card and restart ENVIRON. Keep the phone nearby.
- For internet time and firmware downloads, the phone also needs working internet access. Downloads can use mobile data.
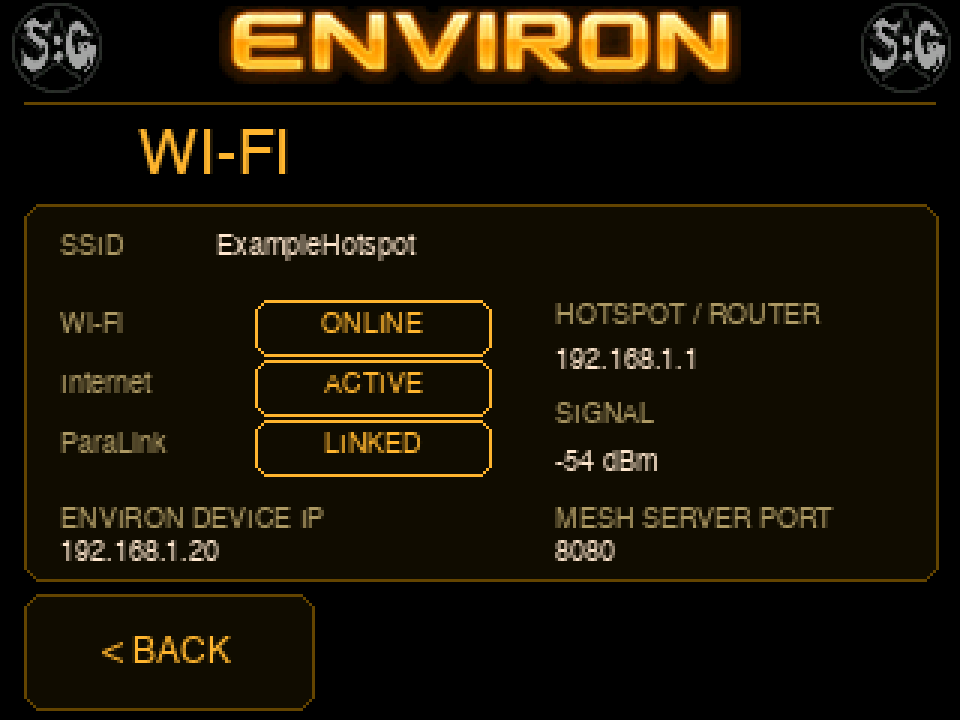
Open Wi-Fi from the menu to see SSID, Wi-Fi ONLINE/OFFLINE, Internet ACTIVE/NO NET, ParaLink LINKED/NO LINK, router/hotspot address, signal strength and the ENVIRON device IP. The Internet status reflects the app’s stored connection state, rather than a continuous independent internet test. The displayed mesh server port is connection information; ENVIRON is not hosting a file-download page there.
Read the aerial icon
The aerial is in the monitoring screen’s left-hand status strip, below the battery.

Wi-Fi disconnected
Red aerial: no current Wi-Fi connection. Local monitoring and CSV recording remain available.

Wi-Fi connected
Green aerial: Wi-Fi is connected. This alone does not confirm internet access or ParaLink-Mesh.

ParaLink-Mesh linked
Blue ring with green stem and base: linked to ParaLink-Mesh over Wi-Fi.
Connect to ParaLink-Mesh

Find out more about ParaLink-Mesh, including app setup and supported controls.
Open compatible ParaLink-Mesh on a device reachable over the same local Wi-Fi network or phone hotspot. ENVIRON attempts discovery and connection automatically. Look for ParaLink LINKED on the Wi-Fi screen or a blue aerial ring on monitoring. Local mesh communication does not require an internet connection. CSV recordings remain on ENVIRON’s card; leaving its monitoring screen also stops recording when controlled remotely.
Update firmware
Connect to a network with internet access and keep stable USB power connected during installation.
- Leave monitoring so CSV recording has stopped, then tap Update in the menu.
- Wait for the installed and available versions to appear. Clock synchronisation can take up to about 45 seconds.
- If an update is available, tap UPDATE to download and install it. Otherwise the screen says You’re up to date and offers CHECK to check again.
- Keep the device powered on while the progress bar advances. Do not use the power or RST buttons or unplug it.
- After Firmware installed, ENVIRON restarts automatically.
- If an error appears, check the message, restore the connection if needed and tap RETRY, or use BACK to return to the menu.

About
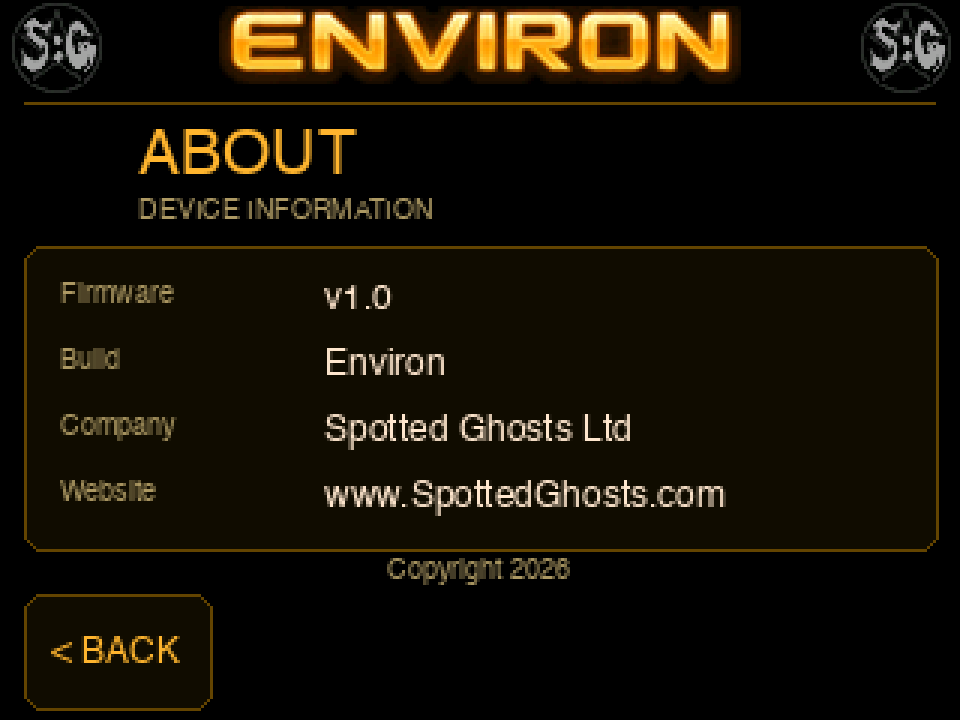
Open About for firmware version, build, company and website details. Include the firmware version and any error message when requesting support.
Troubleshooting
| What you see | What to do |
|---|---|
| NO DATA or — | Allow a moment for readings to arrive. Keep the supplied sensor connections in place. If temperature/humidity stay unavailable, switch off before checking the environmental sensor connection. |
| LIGHT HIGH | The light reading is saturated. Move away from very bright illumination and wait for a valid value. |
| Large movement or magnetic changes | Place the device steadily and consider handling, orientation and nearby magnetic objects. Tap ZERO when ready to choose a new reference. |
| PAUSED / LOG OFF | Tap LOG OFF if you want recording enabled; look for LOG ON and RECORDING. |
| SD ERROR / NO SD / LOG MISSING | Leave monitoring and switch off before checking the card. Confirm it has space and is writable, then restart. Logs are not safely recorded while this error persists. |
| Recording stopped when leaving the screen | This is expected. Logging runs only while monitoring is open. Reopening starts a fresh file if enabled. |
| No dated filename | Set Date and Time. Without a valid clock, ENVIRON uses numbered filenames. |
| Graph has no data column | Choose a compatible ENVIRON CSV file. On-device graphs require the named change column for the selected sensor. |
| File deletion failed | Check the selected file, return to the list and refresh. Switch off before checking the card on a computer. |
| No Wi-Fi or ParaLink link | Check the saved network/hotspot details and compatible running mesh app, then restart. |
| Firmware check or install fails | Check internet access and stable power. Record the error and use RETRY. |
| Touchscreen unresponsive | Briefly press bottom RST to restart, except during firmware installation. Saved CSV rows remain on the card, but monitoring stops. |

Spirit Bell
Spirit BellUser guide Set up your bell, choose which sensors can trigger it, adjust sensitivity ... Read more
Connect your Device to a Router or Hotspot
A quick video guide on how to connect your device to a Router or Hotspot ... Read more