Turn your ENVIRON recordings into large, interactive graphs with the ENVIRON Viewer. 📊
Designed to accompany the ENVIRON environmental monitoring device, this browser-based tool helps you review sensor readings, examine changes and compare recordings after an investigation or monitoring session.
Simply copy a CSV recording from your device’s SD card to your computer and upload it to the ENVIRON Viewer.
Your recordings are not saved on our servers.
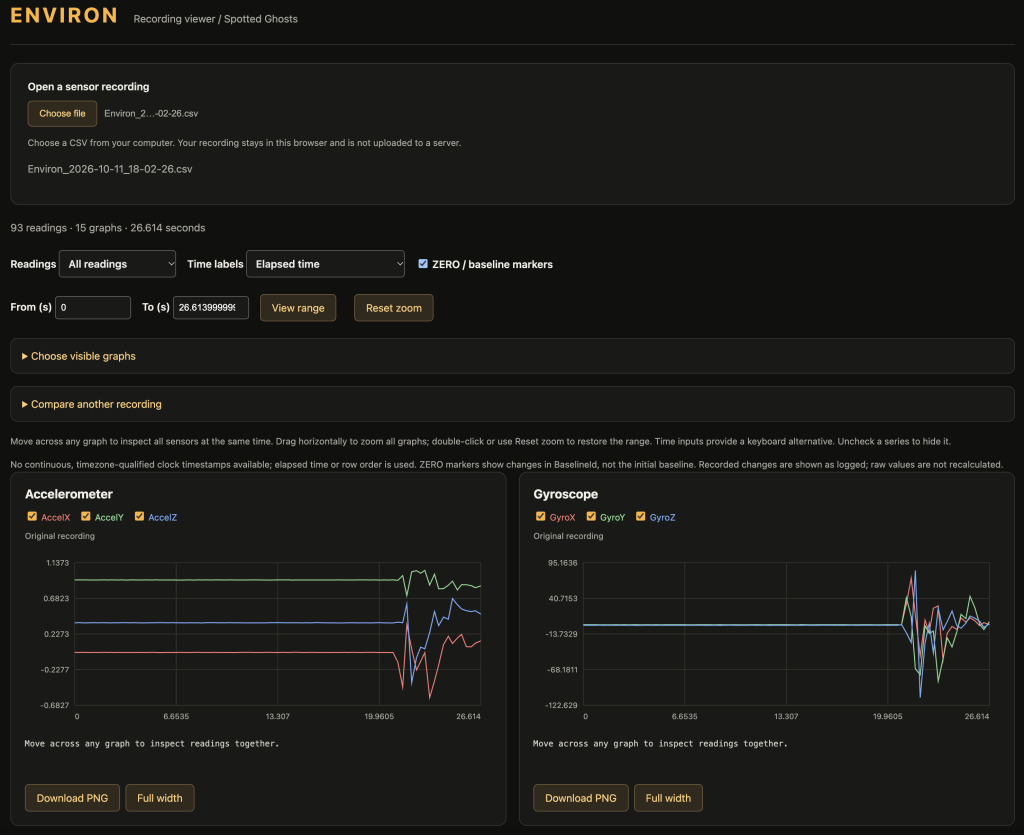
CLICK HERE TO VISIT THE ENVIRON VIEWER
📈 See Your Data in Greater Detail
ENVIRON CSV Viewer displays the measurements available in your recording as individual sensor graphs.
Depending on the columns stored in the file, these can include:
- Accelerometer — X, Y and Z acceleration readings.
- Gyroscope — X, Y and Z rotation readings.
- Magnetometer — X, Y and Z magnetic-field readings.
- Temperature — recorded temperature measurements.
- Humidity — recorded relative humidity.
- Light — recorded light measurements.
- Proximity — recorded proximity sensor values.
- Recorded changes — changes calculated and saved by ENVIRON.
Each graph automatically adjusts its scale to the readings within the selected range. Missing or invalid readings appear as gaps.
Graphs only appear for measurements present in your CSV file.
🔎 Examine Activity Across Multiple Sensors
Move your pointer across any graph to display a linked cursor across the other visible graphs.
This lets you inspect what different sensors recorded around the same moment—for example, whether a magnetic-field change coincided with movement, light or temperature changes.
The readouts show the nearest recorded samples, helping you distinguish actual recorded values from the position of your cursor.
Zoom Into a Recording
Click or touch a graph and drag horizontally across the section you want to examine. All graphs zoom to that time range together.
You can also enter a precise range using the From and To fields, then select View range.
Select Reset zoom, or double-click a graph, to return to the full recording range.
🎛️ Choose How You View Your Readings
Use the Readings selector to choose:
- All readings — display both raw measurements and recorded changes.
- Raw readings — focus on the original sensor measurements.
- Recorded changes — focus on the change values saved by the device.
The viewer displays changes as they were recorded. It does not recalculate or alter your original sensor data.
Open Choose visible graphs to hide measurements you do not need. Each graph also includes:
- Series checkboxes for showing or hiding individual traces.
- A Full width button for a larger view.
- A Download PNG button for saving an image.
🟠 Understand ZERO and Baseline Changes
When a recording contains a BaselineId column, the viewer can mark where that reference changes.
These ZERO / baseline markers help you identify reference resets, so a change caused by resetting the device’s baseline is easier to distinguish from other activity.
Use the marker checkbox to show or hide them. The initial baseline is not shown as a reset event.
🕒 Review Elapsed Time or Recorded Clock Times
By default, graphs use elapsed time from the first usable reading.
If the CSV contains suitable, continuous timestamps with time-zone information, you can select Recorded clock time (UTC) instead.
Recordings without suitable clock timestamps remain displayed using elapsed time. If no recognised time column is available, the viewer uses row order and labels it accordingly.
The viewer does not infer clock times from the filename.
📊 Compare Two Recordings
Load a second CSV to compare matching sensor columns from two recordings.
- Recording A uses solid lines.
- Recording B uses dashed lines.
Both recordings initially start at zero. Use Comparison offset to adjust their alignment:
- A positive offset moves recording B later.
- A negative offset moves recording B earlier.
Where both recordings contain suitable clock timestamps, Align recorded timestamps positions them according to those recorded times.
This is useful for comparing sessions, repeated experiments or recordings from multiple ENVIRON devices. Timestamp alignment depends on the accuracy of the clocks used when recording.
🖼️ Download Graphs for Reports and Sharing
Select Download PNG beneath any graph to save it as an image.
The exported image includes:
- The graph title.
- The original CSV filename in the top-right corner.
- The selected time range.
- The visible sensor-series legend.
- Comparison traces and alignment information when loaded.
- Baseline markers when enabled and available.
The image reflects your current graph settings, making it easy to share a particular section of a recording without sending the entire CSV file.
Your original CSV remains unchanged.
📂 How to Use ENVIRON Viewer
1. Record Your Data
Use your ENVIRON device to record a monitoring session to its SD card.
Stop recording before removing the card, following the device’s normal shutdown procedure.
2. Copy the Recording to Your Computer
Insert the SD card into your computer or a compatible card reader.
Copy the CSV recording you want to review to a folder on your computer.
3. Open the Viewer
Open ENVIRON CSV Viewer in your browser.
If you downloaded the standalone viewer, open its HTML file in your browser. The standalone file can be used without an internet connection.
4. Choose Your CSV
Under Open a sensor recording, select Choose File or the equivalent button shown by your browser.
Choose your ENVIRON CSV recording. The viewer will read the file and display its available sensor graphs.
Maximum file size: 25 MB per recording.
5. Explore the Graphs
Move across a graph to inspect readings, drag to zoom, or enter a time range.
Use Choose visible graphs and Full width to arrange the display around the measurements you want to examine.
6. Compare Another Recording — Optional
Open Compare another recording and select a second CSV.
Adjust its offset manually, or use timestamp alignment when available.
Select Remove comparison to return to a single recording.
7. Save a Graph Image
Set the time range and visible traces you want, then select Download PNG beneath the graph.
Your browser will download the image using its normal download settings.
🔒 Your Files Stay With You
ENVIRON CSV Viewer reads your locally selected files in the browser.
- No recording upload is saved on our servers.
- No changes to your original CSV files.
- No account required for the viewer.
The viewer does not save your session. If you refresh or close the page, select your recording again to continue reviewing it.
💡 Tips for Reviewing Recordings
- Check graph scales. Each graph scales independently, so similarly sized movements on different graphs do not necessarily represent comparable changes.
- Look at the numeric readings. Zooming can make small variations look prominent.
- Check baseline markers. A reference reset can affect recorded change values.
- Check clock alignment. Two recordings showing the same clock time are only as well synchronised as the devices that recorded them.
- Keep your original CSV files. Graph images are useful for presentation, while CSV files preserve the underlying measurements.
❓ Troubleshooting
My file does not load
Check that it is a CSV recording, is smaller than 25 MB and contains a header row followed by data. Unedited files copied directly from ENVIRON are the best starting point.
Some graphs are missing
The viewer only creates graphs for usable numeric columns present in the recording. Also check your reading filter and visible-graph selections.
There are gaps in a graph
Blank or invalid measurements are displayed as gaps rather than being replaced with invented values.
Clock time is unavailable
The file may contain elapsed time only, or its timestamps may lack the information needed for reliable clock labels.
ZERO markers are missing
The recording must contain a BaselineId column with a recorded change in its value.
My comparison does not line up
Adjust the comparison offset. Automatic timestamp alignment is only available when both recordings contain suitable timestamps.
⚠ Important Information
ENVIRON CSV Viewer is a tool for displaying and comparing recorded measurements. Interpret readings alongside your investigation notes, device placement, surrounding conditions and other observations.
ParaLink-Mesh
The ParaLink-Mesh unites Spotted: Ghosts devices into one powerful, connected system - Something that has ... Read more